
Research
Process and Findings | Spring 2016
Data Collection
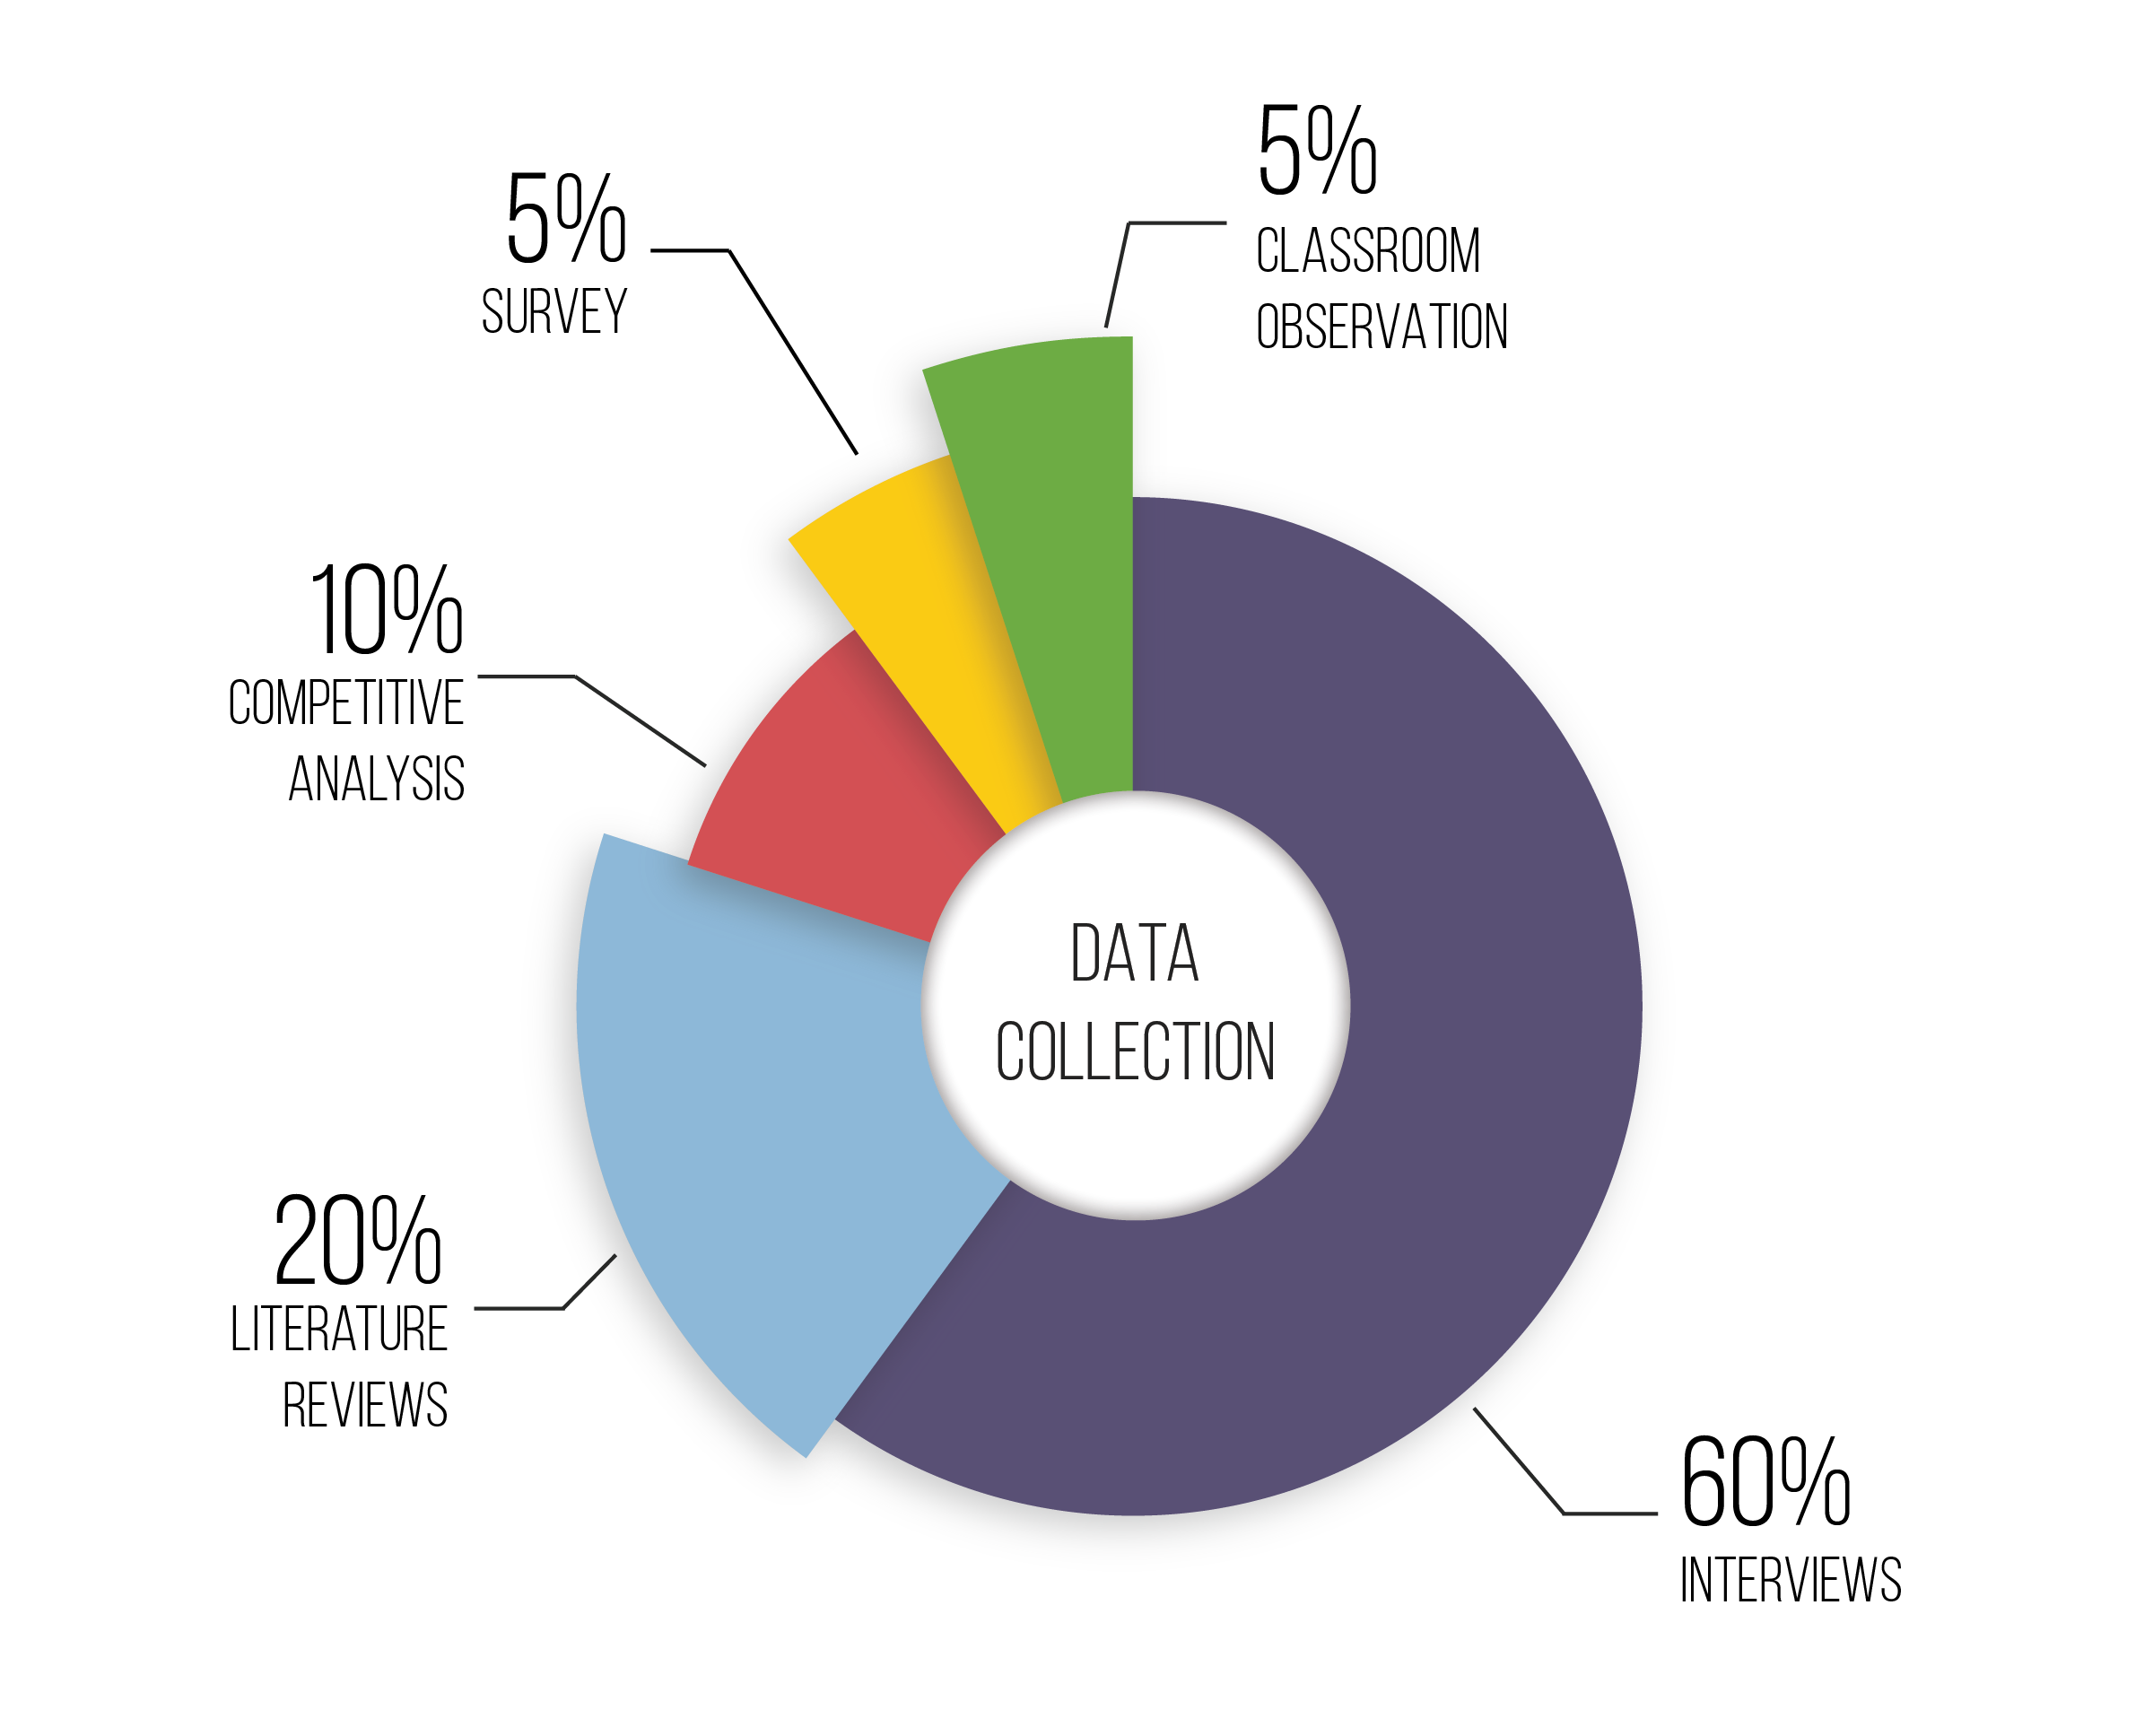
In doing our research, we utilized various different methods. We tried to involve users as much as possible in our research process, but we also looked into other secondary research methods such as literature review and competitive analysis. The following graphic shows how much each method contributes to our findings:
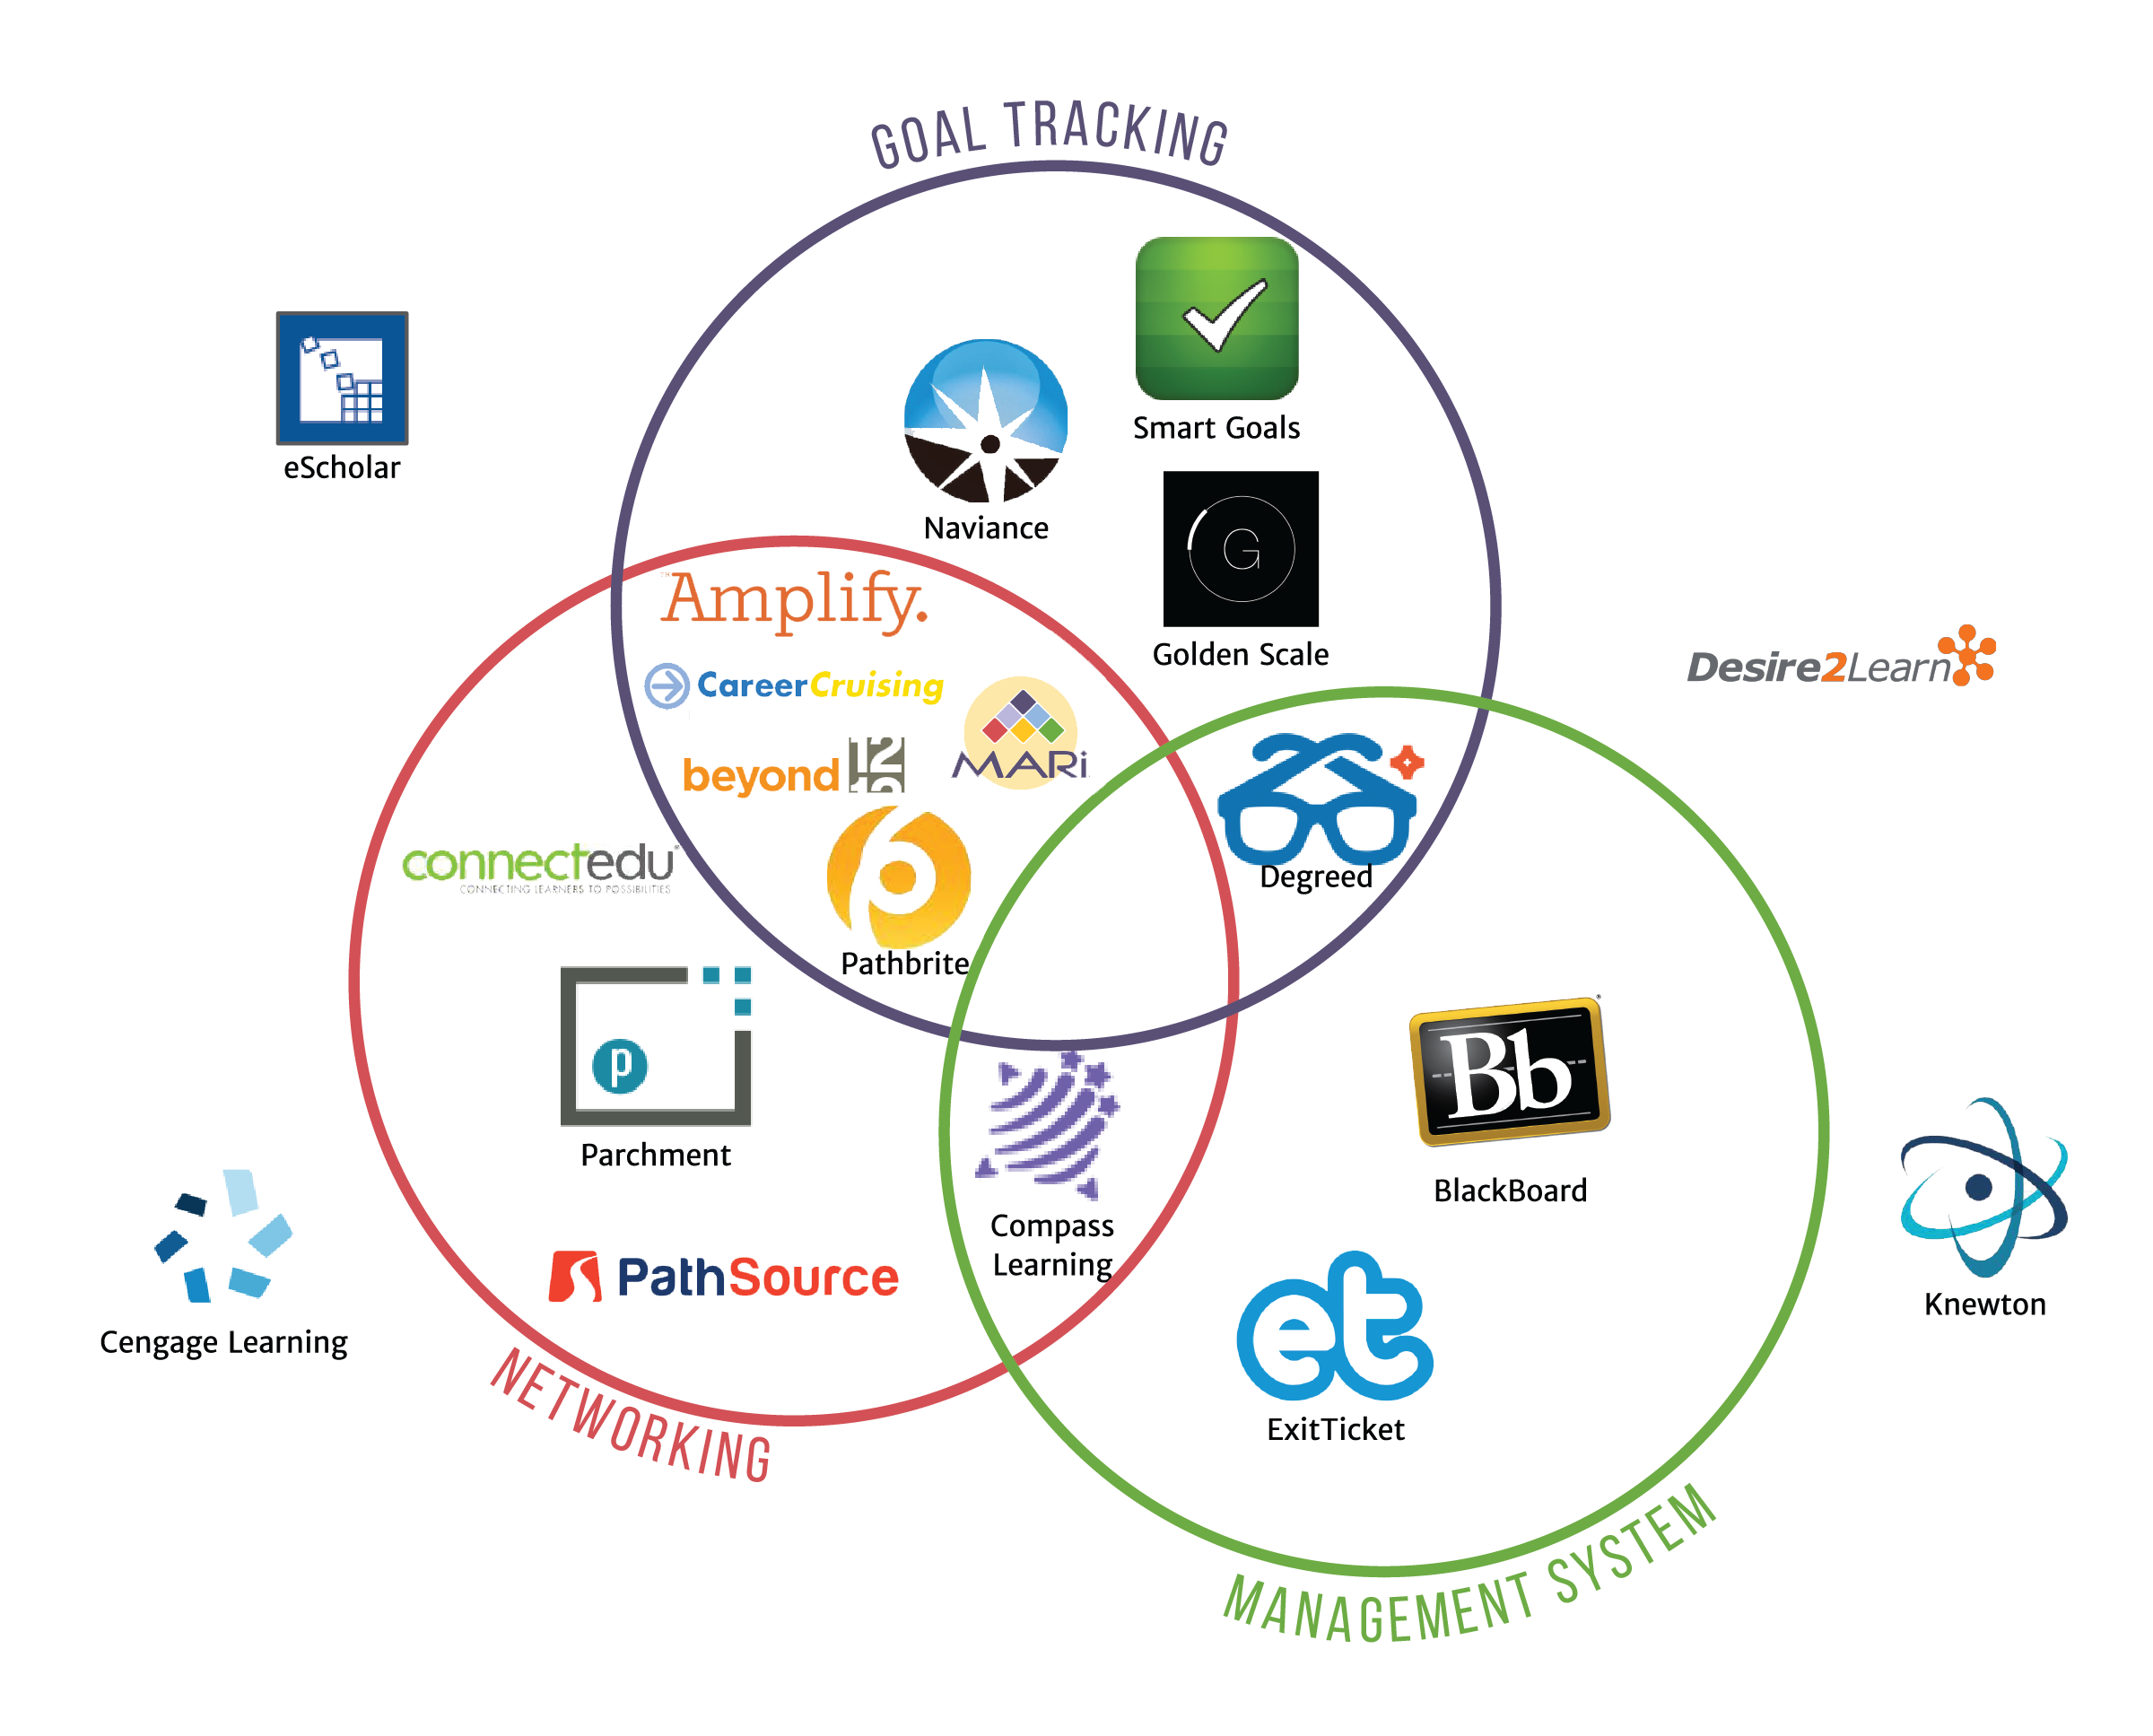
We began our process by doing literature review and competitive analysis to familiarize ourselves with the existing relevant research. We went through 13 literature reviews in gamification, goal systems, motivation, personal data, and feedback. For our competitive analysis, we evaluated over ten different companies. Each company excels in different areas, but we limit our search into three main categories, which are goal tracking, networking, and management systems. MARi's position is highlighted in the following graphic:
Afterwards, we conducted a total of 36 interviews to gain insights about how students navigate their career path. These interviews were done over the phone and in-person (typically at a school).
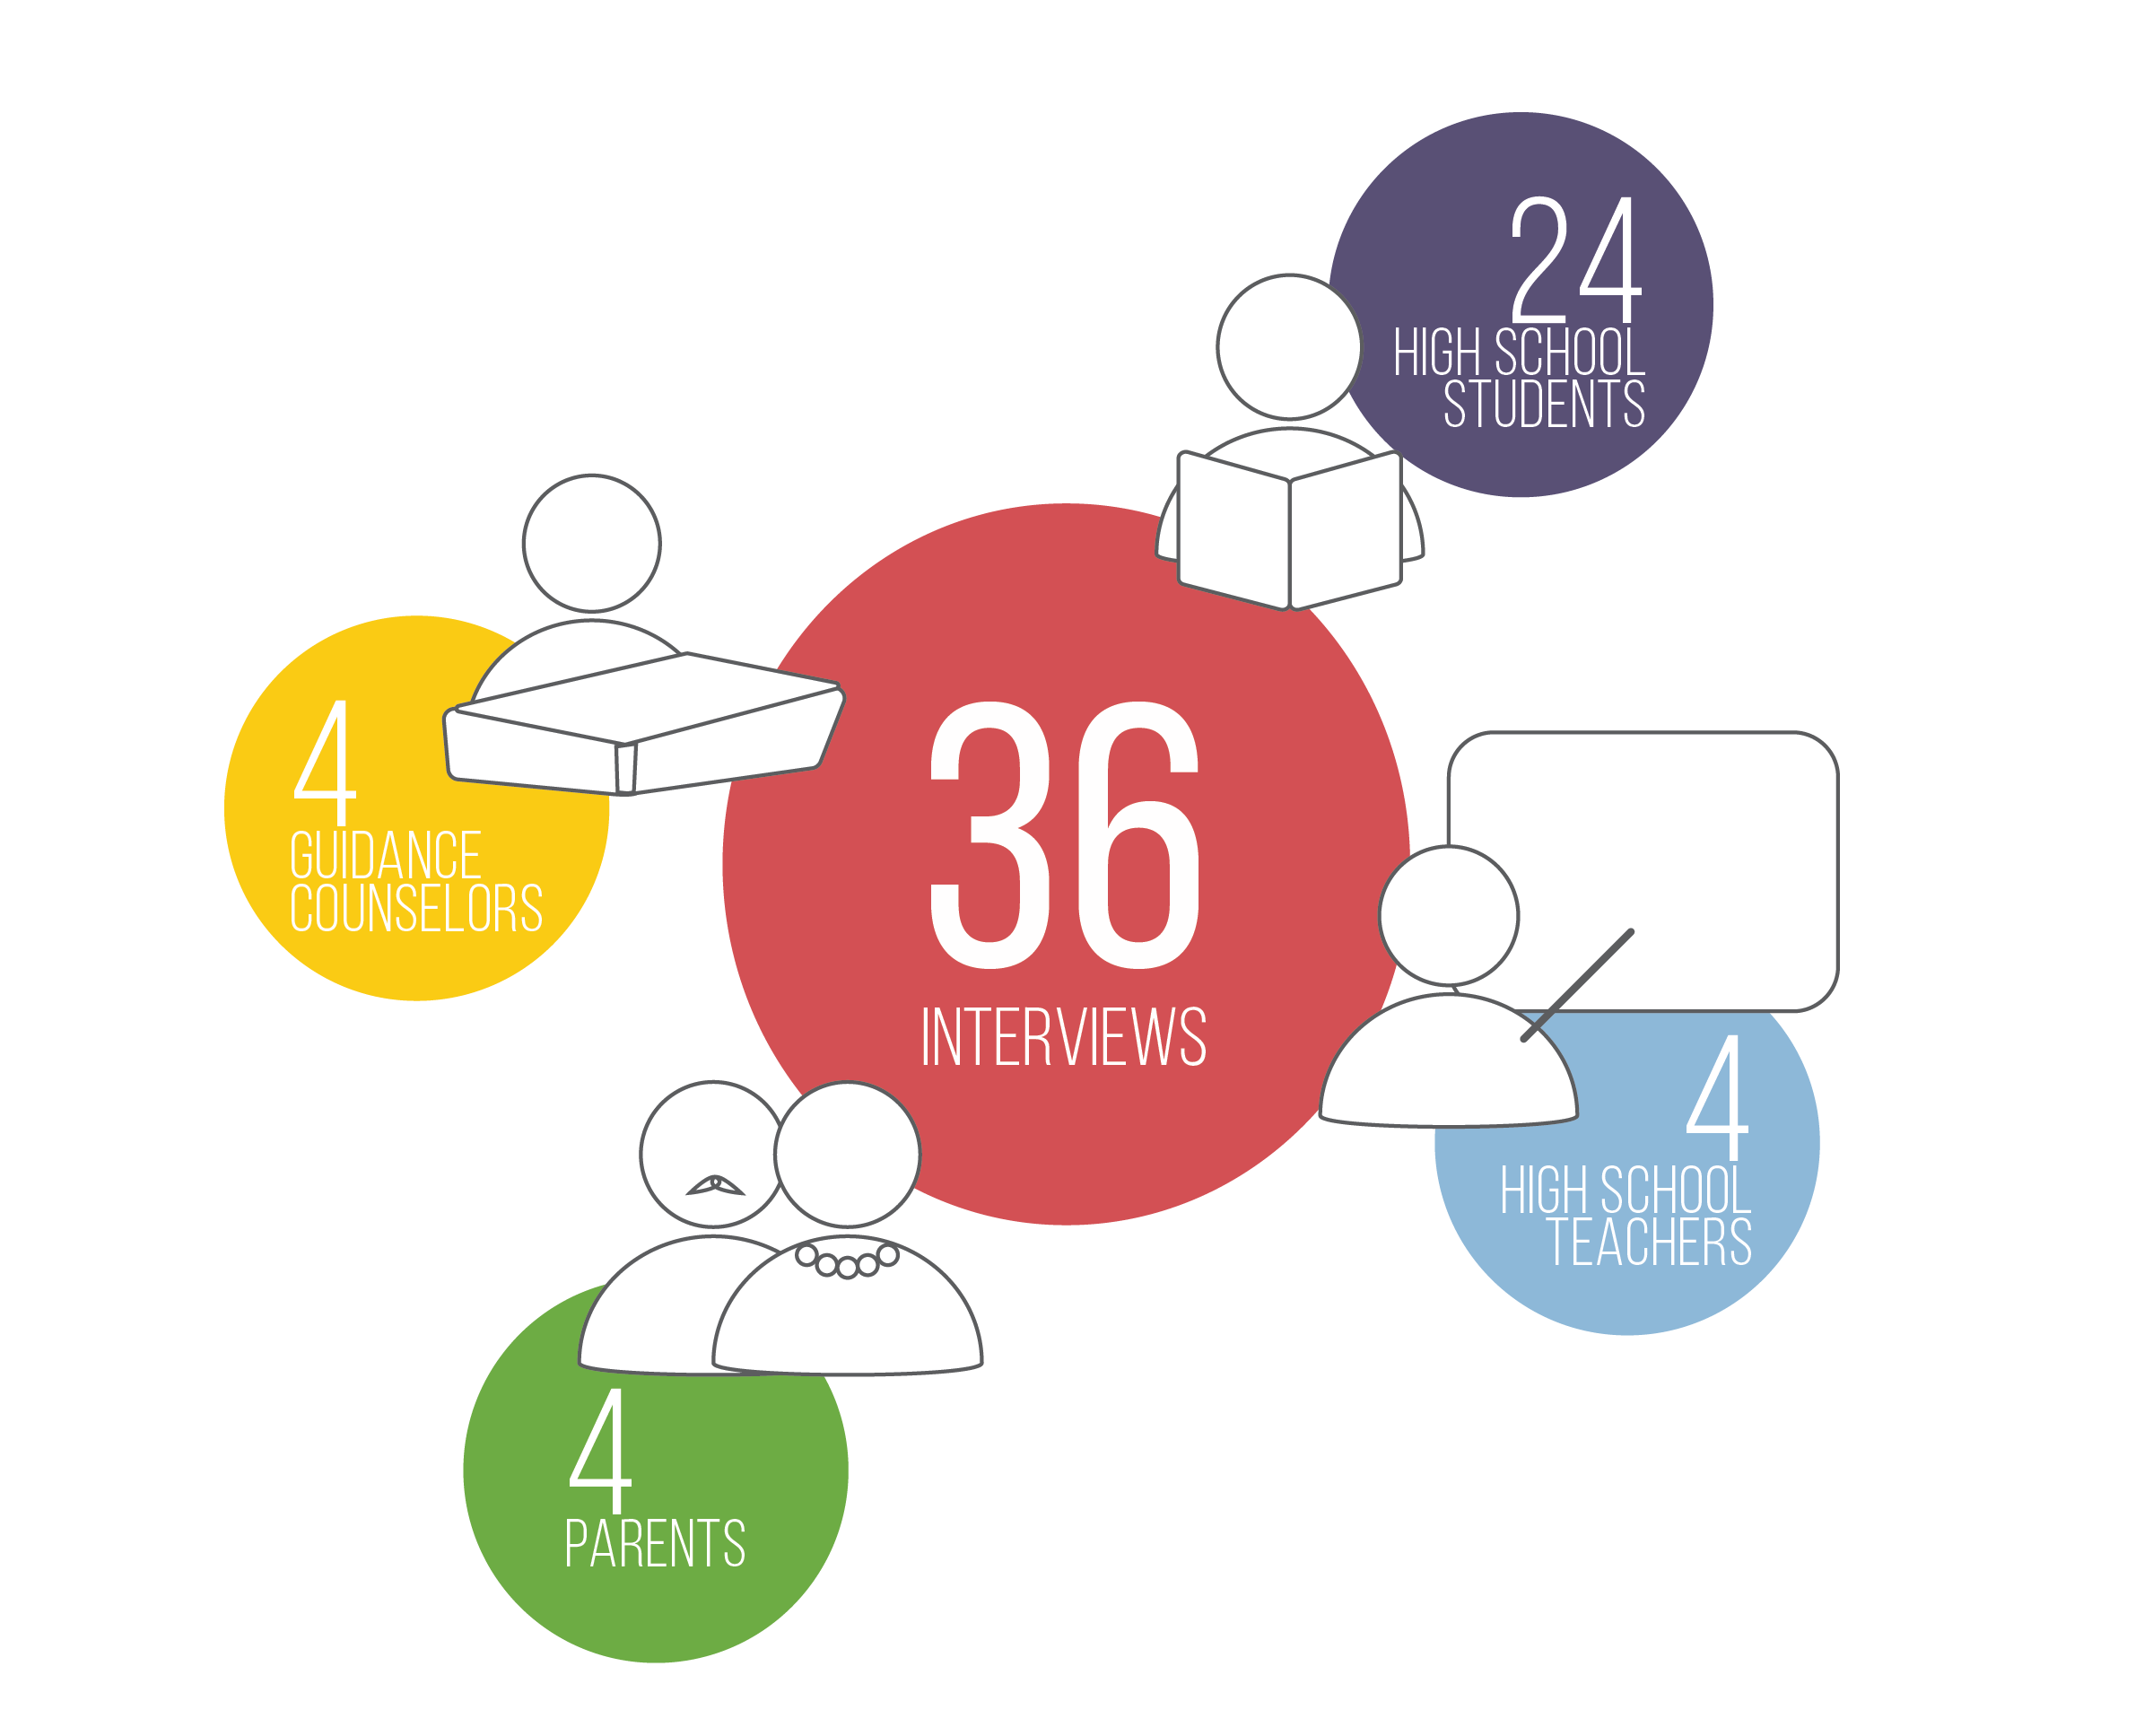
The graphic above shows four categories of our interview participants. These demographics were chosen for the following reasons:
- High school students are MARi Mobile’s target users. Students were from a variety of high schools from both Pittsburgh, Pennsylvania and the Washington, D.C. area.
- High school teachers have insight into whether a student is academically and personally suited for certain career paths.
- Guidance counselors are trained to mentor high school students and give them career and academic advice. They are therefore a major part of implementing college/career planning software.
- Parents observe their children over a long period of time and are often the most available resource for high school students for career planning. Students often best understand the professions that their family is in because there is natural exposure at home through conversation and observation.
From our interviews, we found some interesting quotes from the participants, which then lead us to the question of how people has been handling career redirection and adjustment. As an additional information that would then feed into our research, we conducted a survey to investigate how current professionals reached their current path, the redirections they took, and what lessons they learned. Questions ranged from rating on a provided scale how motivational di erent factors were in career selection (such as family, school, and friends), to providing personal anecdotes of career paths.
Some notable results that we gained from the survey are:
- Family and self were the strongest sources of motivation.
- 60% of surveyed professionals changed their careers at least twice, most of them before the age of 35.
- The top lesson professionals wished they knew in high school was “Take some time to reflect on where you are and where you want to go.”
Finally, as an additional data, we integrated the results of our classroom observation. We had the opportunity to observe two career class sessions at Steel Valley High School in Pittsburgh, PA. In this class, 9th graders are taught to fill out job applications, practice interviews, talk about work culture, and are encouraged to start thinking about their future. Each class has approximately 10 students. None of us had experienced this type of career class in our own high schools, so this observation was essential to understand how current high schools are preparing their students for careers.
Data Synthesis
At the end of our research process, we had hours of recorded interviews and pages of notes from research articles and observations. This section describes our process of synthesizing the data gathered during our research. We used a variety of human-centered design techniques to select salient points such as insightful interview quotes and applicable findings from research papers, and then identify emerging themes. We present these techniques here, as they particularly facilitated synthesis of data across sources. It is natural for researchers to mentally synthesize data as it is acquired, and these techniques allowed us to more objectively assess the results.
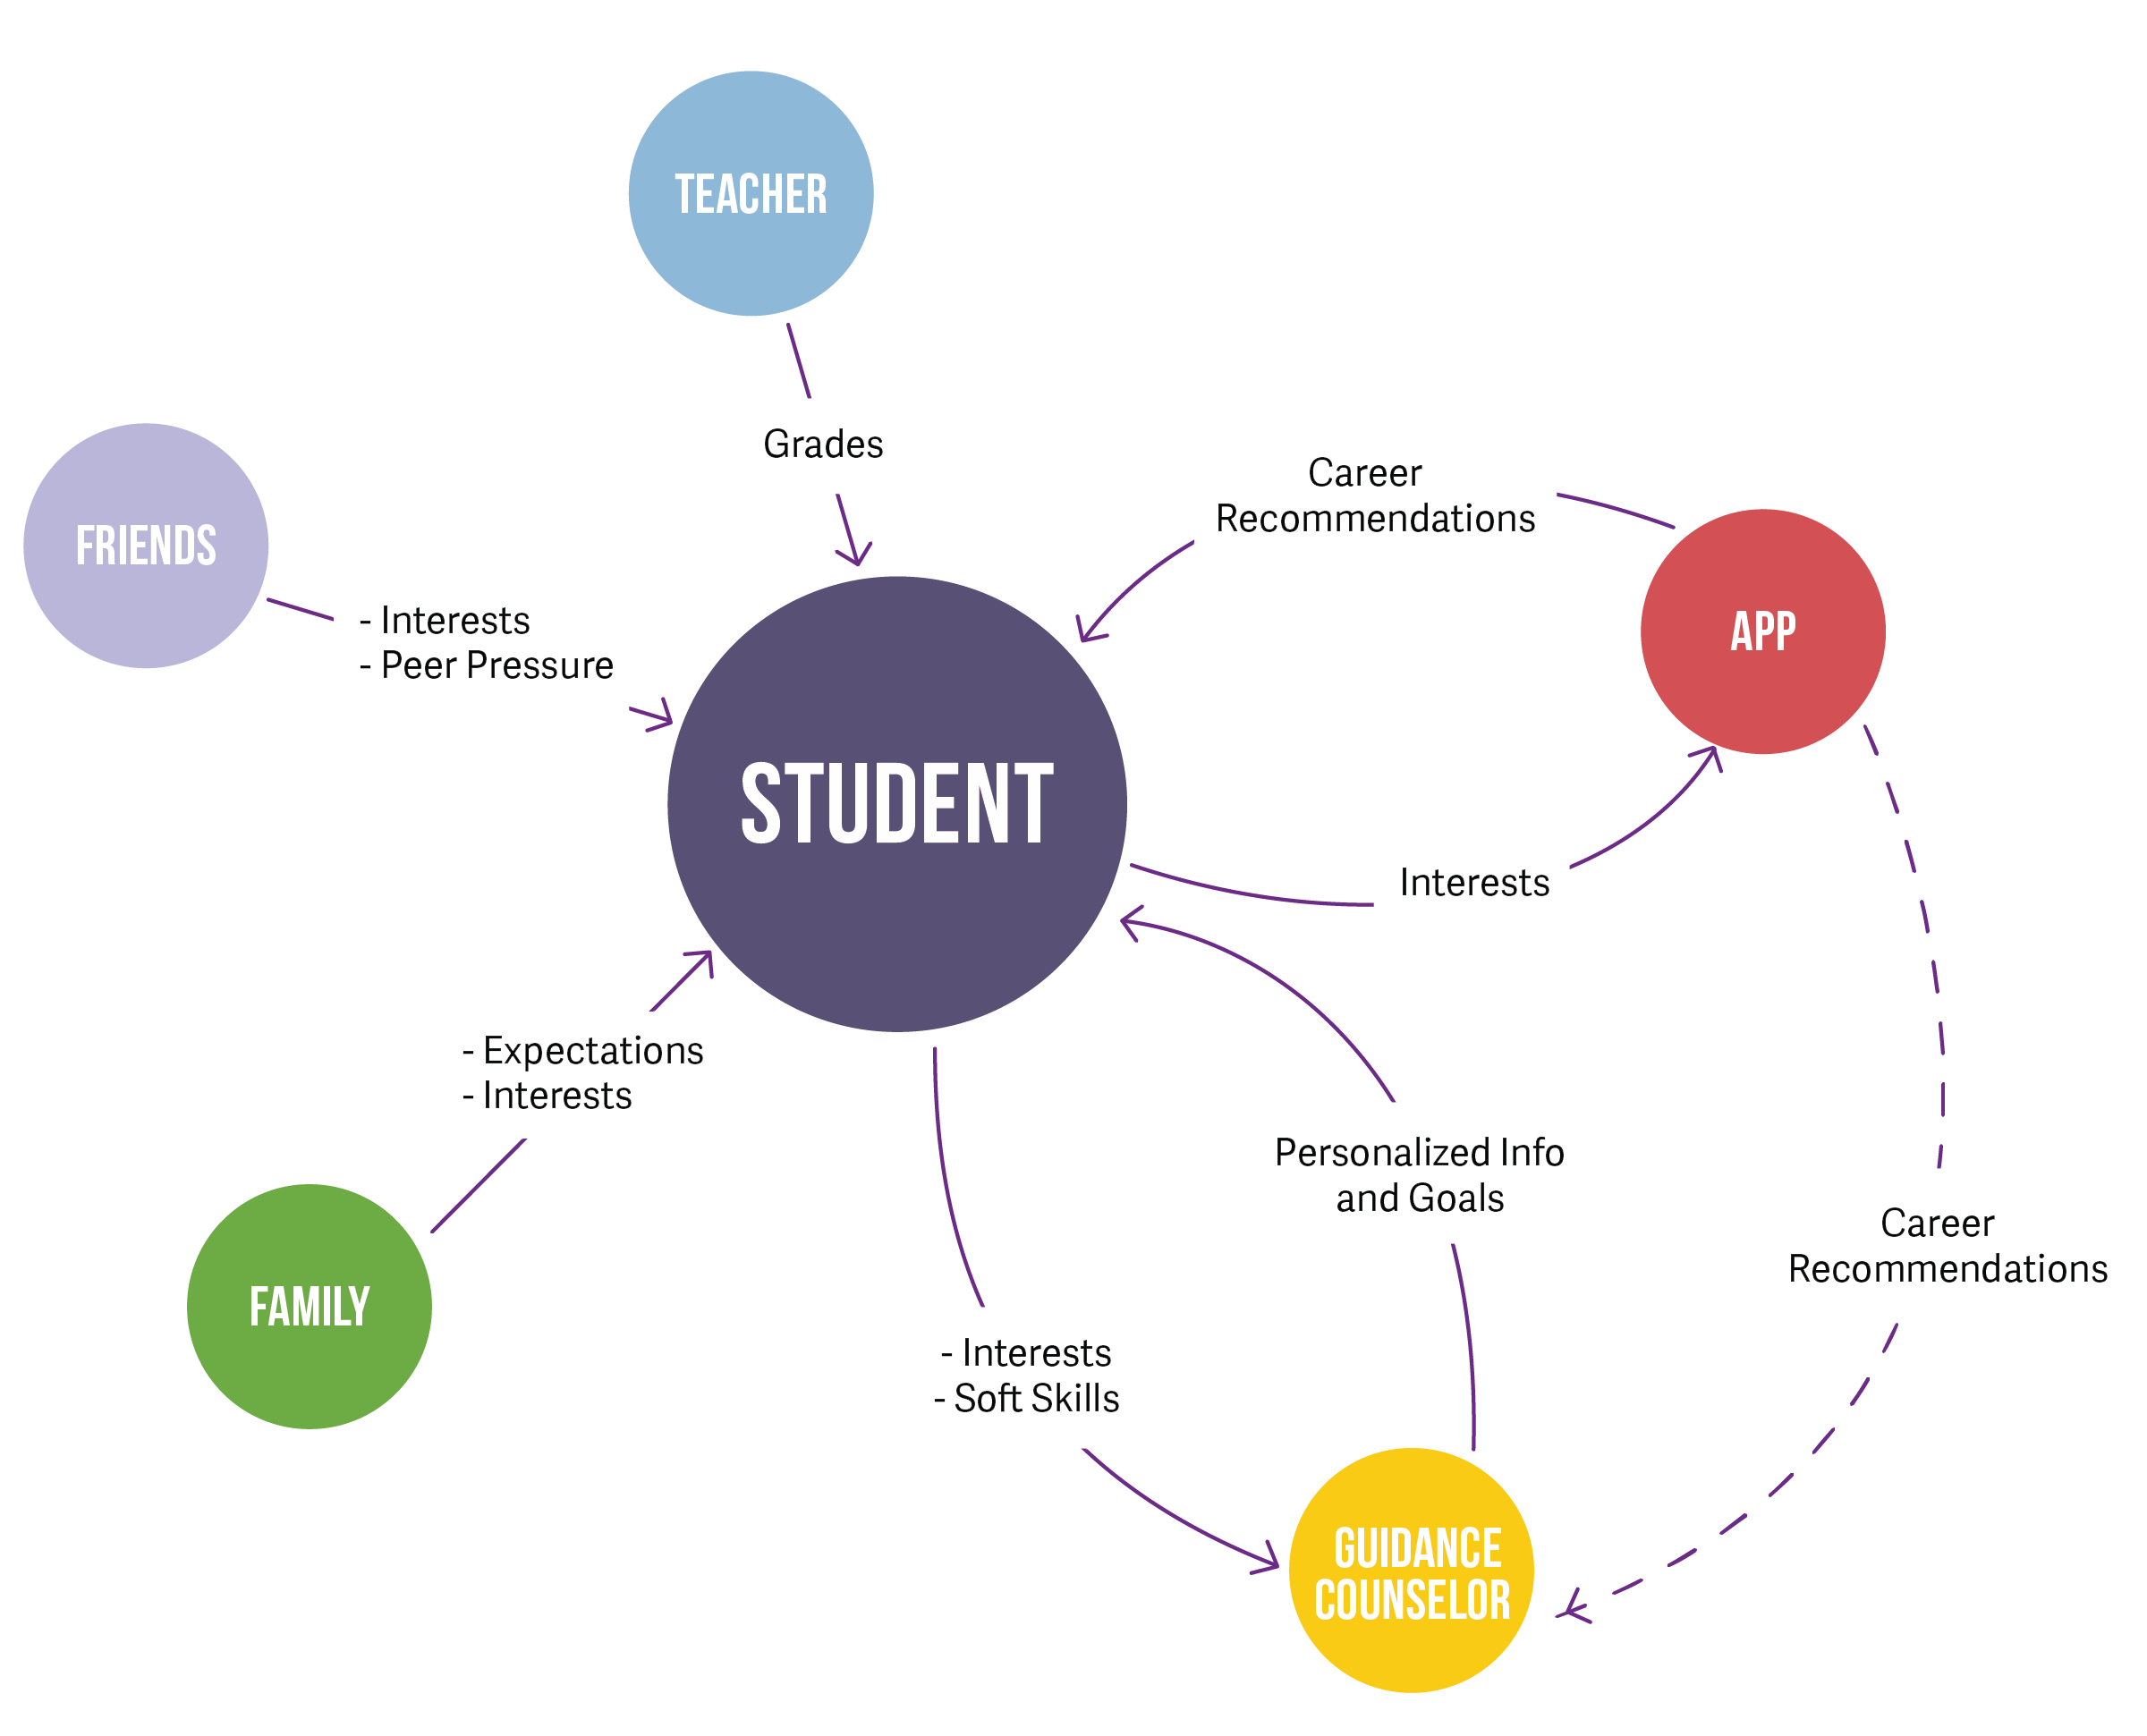
A flow model is a graphical representation of the “flow” of data through an information system, modelling its process aspects. It is often used as a preliminary step to create an overview of the system, which can later be elaborated. A flow model shows what the system will input and output, in terms of information, as well as where the data will come from and go to, and where the data will be stored. In our capstone project, the “system” is the current model of how high school students give and receive information about their career choices.
This activity allowed us to see the context of how MARi Mobile would fit into the existing system. After completing approximately one-third of our interviews, we drew out a student-centered flow model based on data contributed by students, guidance counselors, teachers, and existing career planning software.
Affinity Diagram
Affnity diagramming is a human-centered research technique that facilitates combining individual data points into synthesized findings. It is particularly useful at revealing common themes across sources since majority of the data is qualitative.
- Write it down. Transcribe all interviews, take notes from all the research papers, write out the survey results, etc.
- Break it apart. Separate out individual quotes and ndings by printing each on a separate slip of paper.
- Put it back together. Iteratively arrange the slips of paper in clusters based on emerging themes and commonalities.
Follow these steps to see how we sorted 949 individual data points into 46 clusters, 80 cluster findings, 14 categories, and ultimately 9 research findings:
-
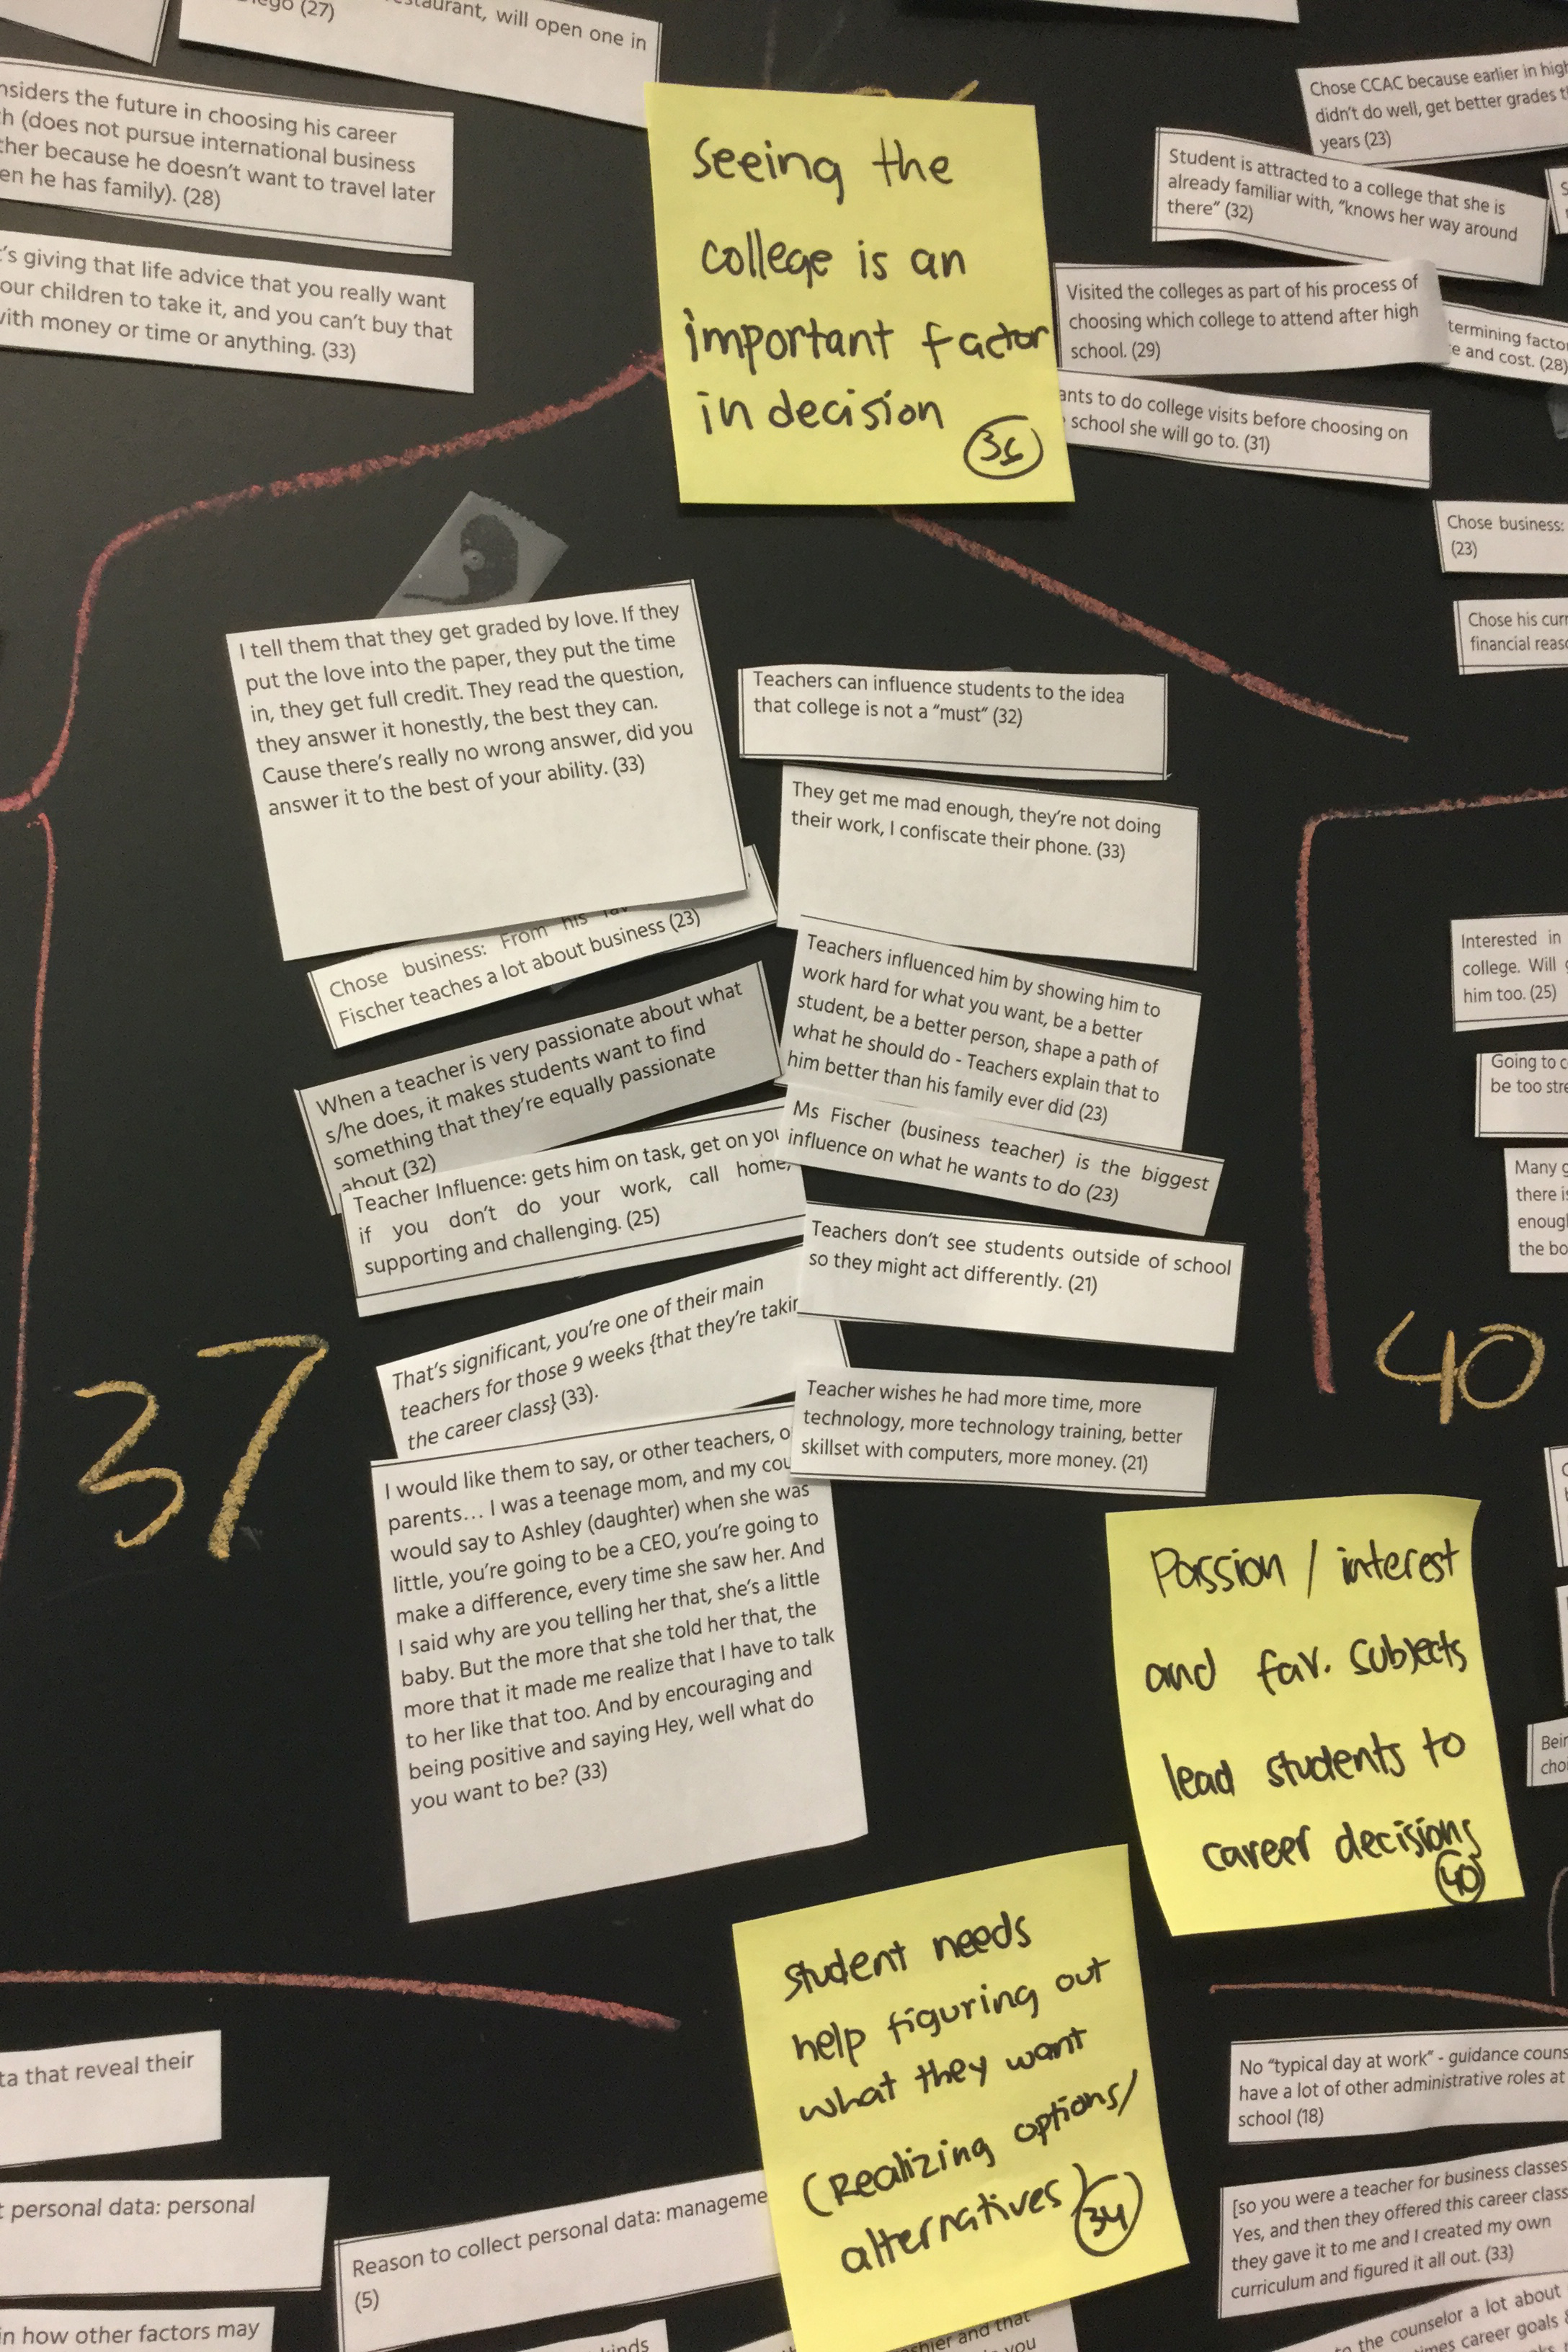
949 data points → 46 clusters | An example of Cluster 37 is shown on the image above. Over the course of 4 hours, this cluster gradually became filled with raw data describing the ways teachers influence students, from both the teacher and student perspective.
-
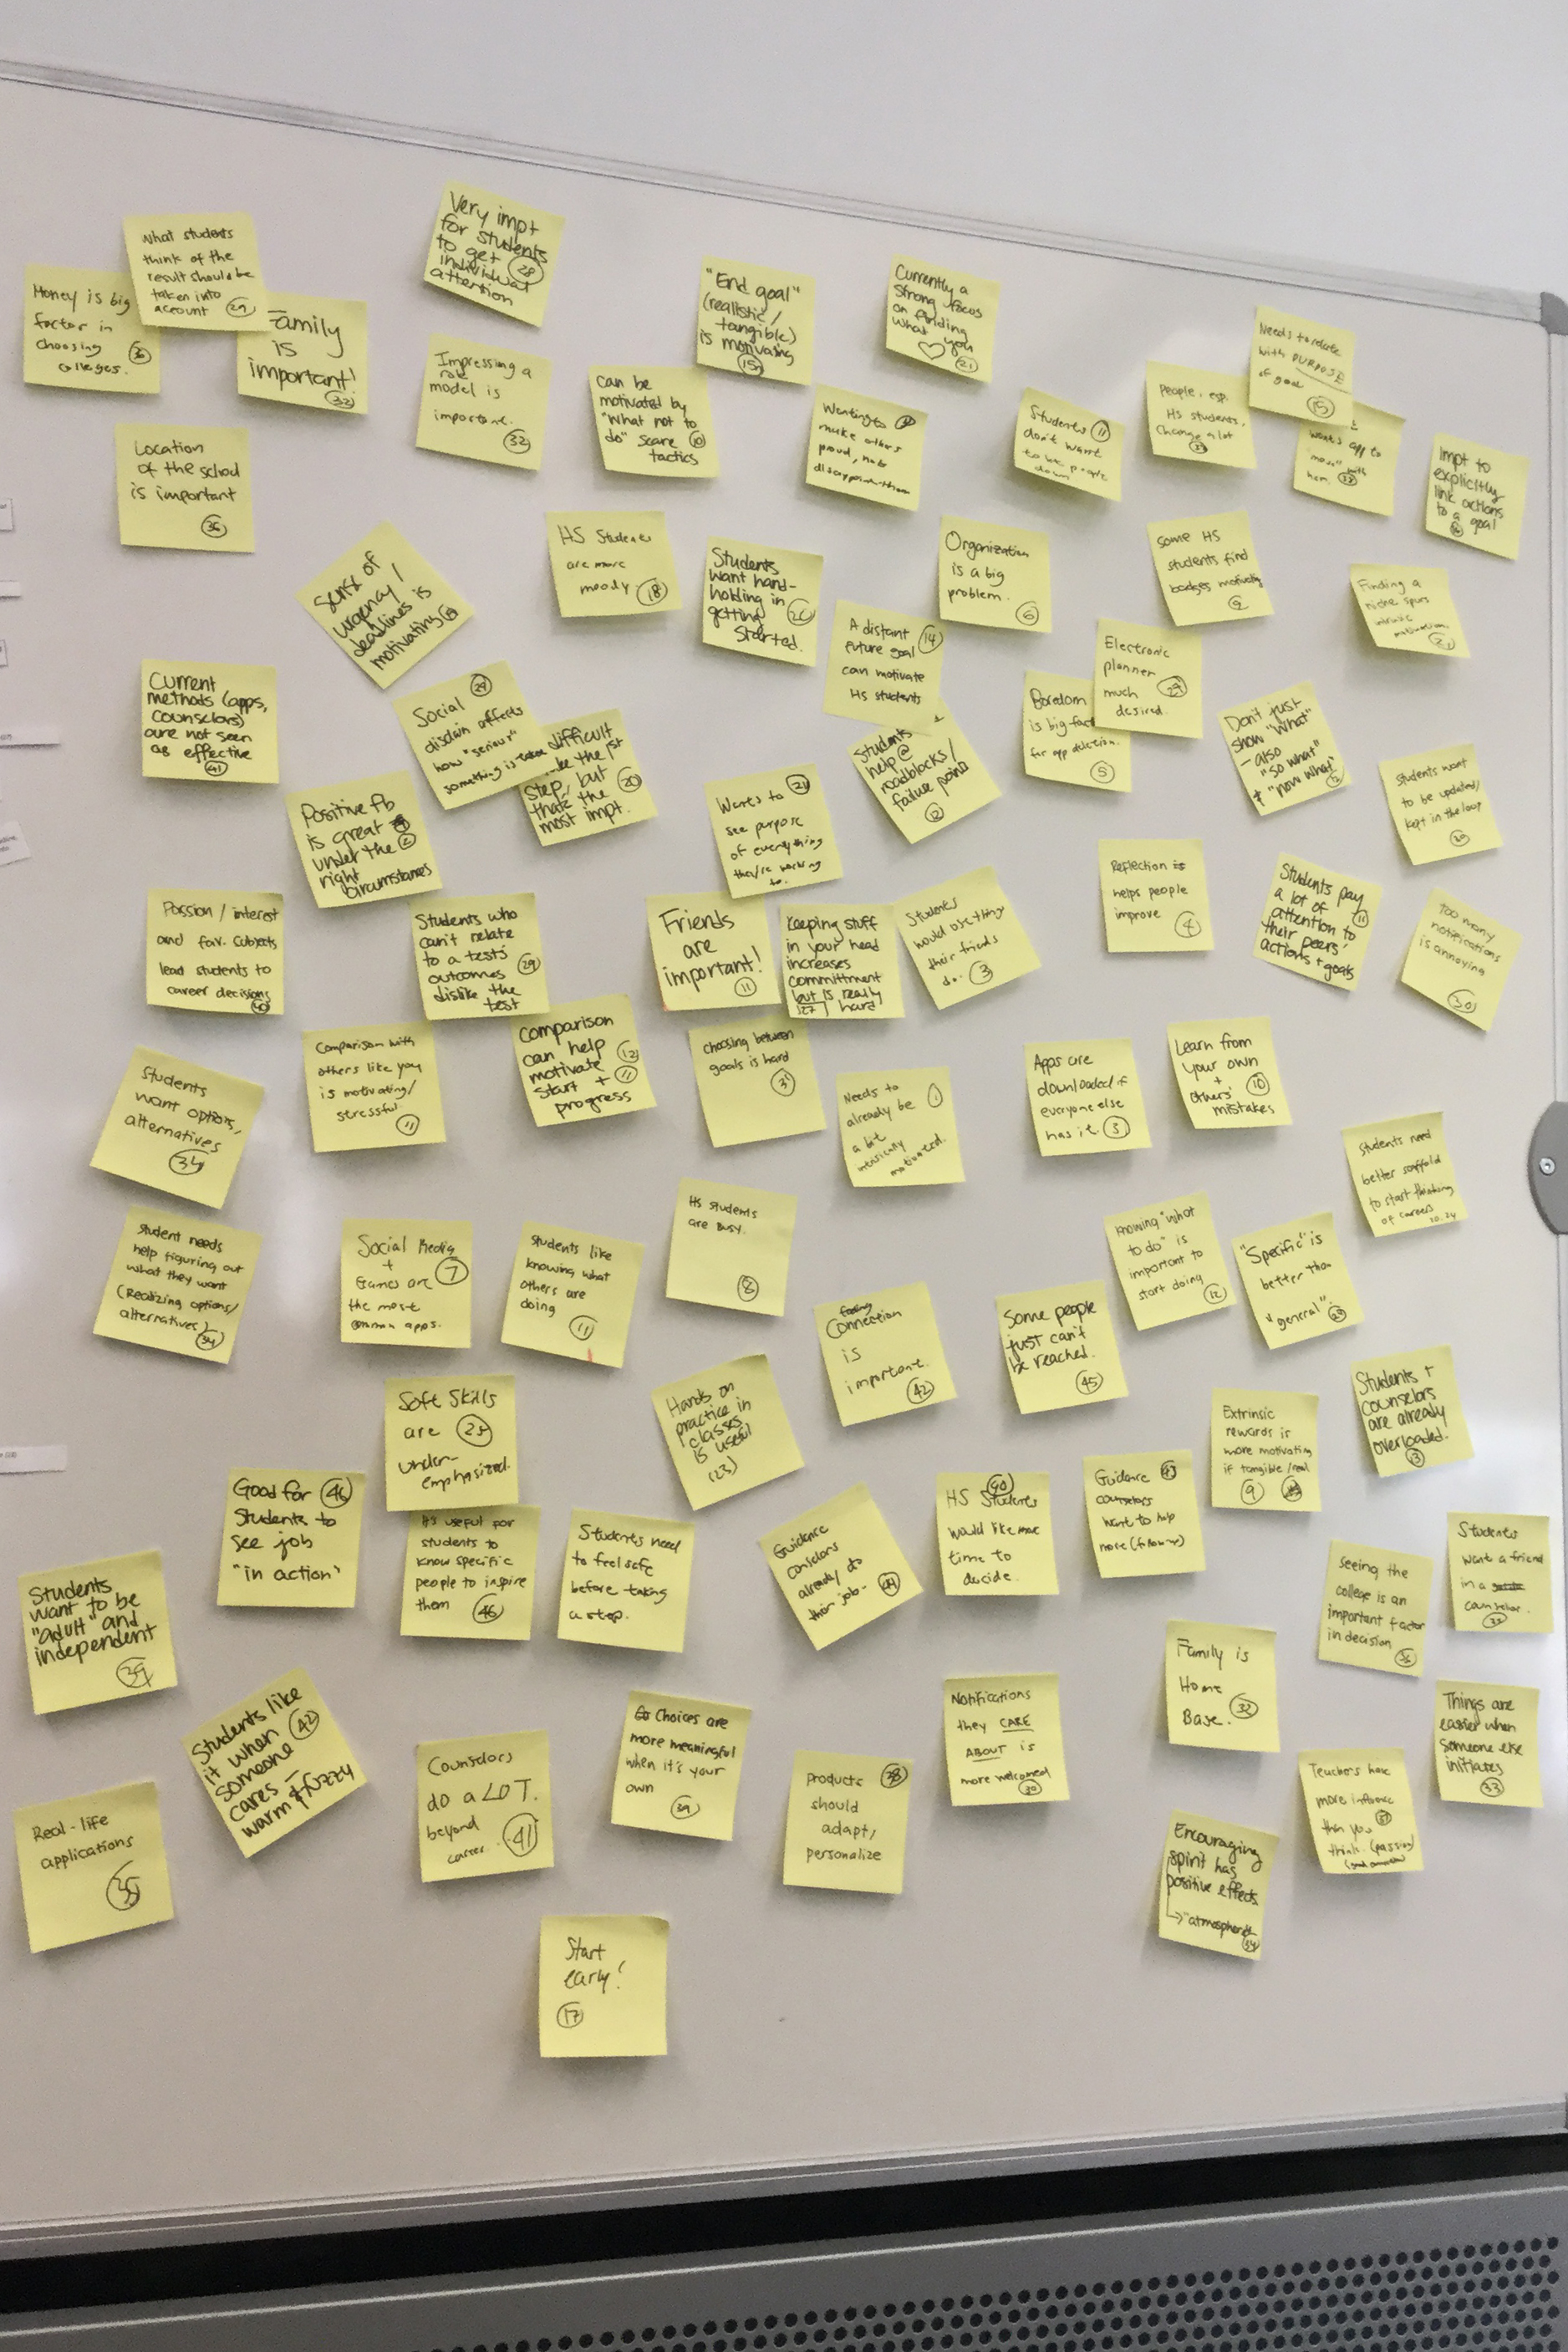
46 clusters → 80 cluster findings | After the initial clustering with the printed data points, we wrote down what we saw as meaningful findings from each cluster on yellow post-it notes. Each cluster finding was labeled with the number of its source cluster, so that we could easily trace categories back to raw data. From 46 clusters, we synthesized 80 cluster findings; larger clusters usually had more findings. For example, for Cluster 37, we added the cluster finding: Passion/interest and favorite subjects lead students to career decisions.
-
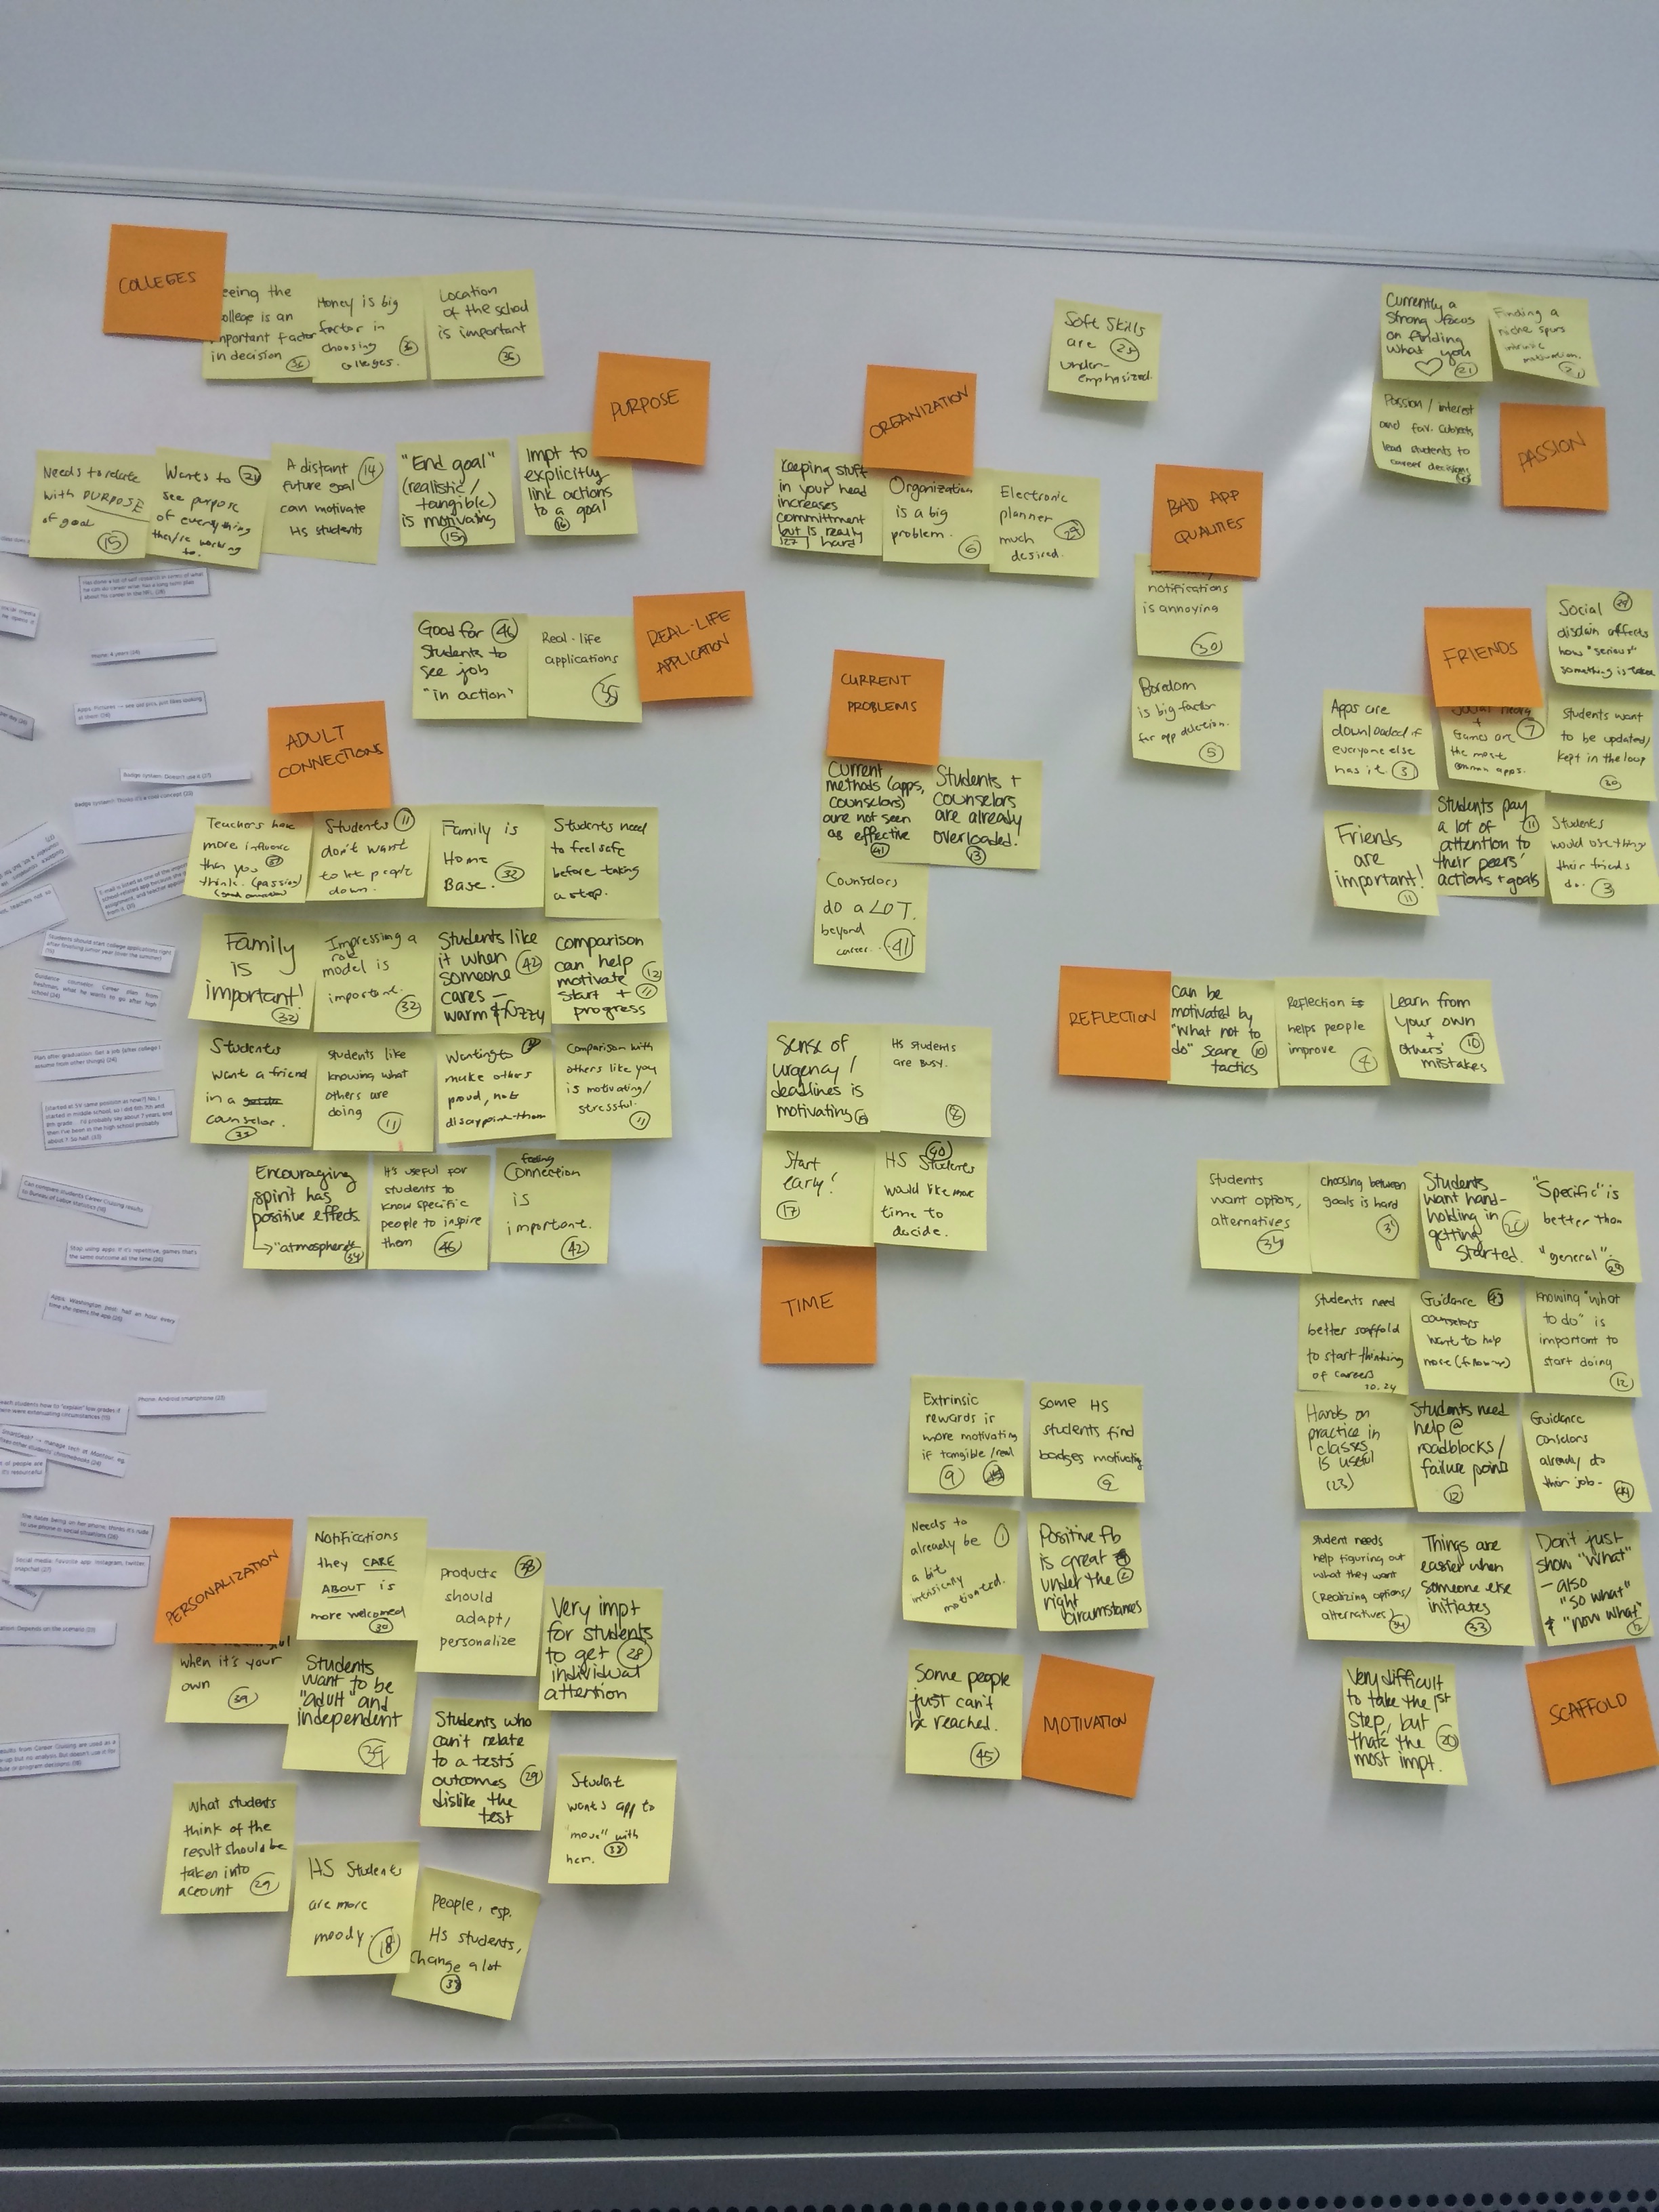
80 cluster findings → 14 categories | We completed a second, brief round of affnity diagramming with the 80 cluster findings, resulting in 14 categories (on orange post-it notes). For example, the following cluster findings were grouped together in a Reflection category:
- Can be motivated by “What not to do” scare tactics (Cluster 10)
- Reflection helps people improve (Cluster 4)
- Learn from your own + other’s mistakes (Cluster 10)
-
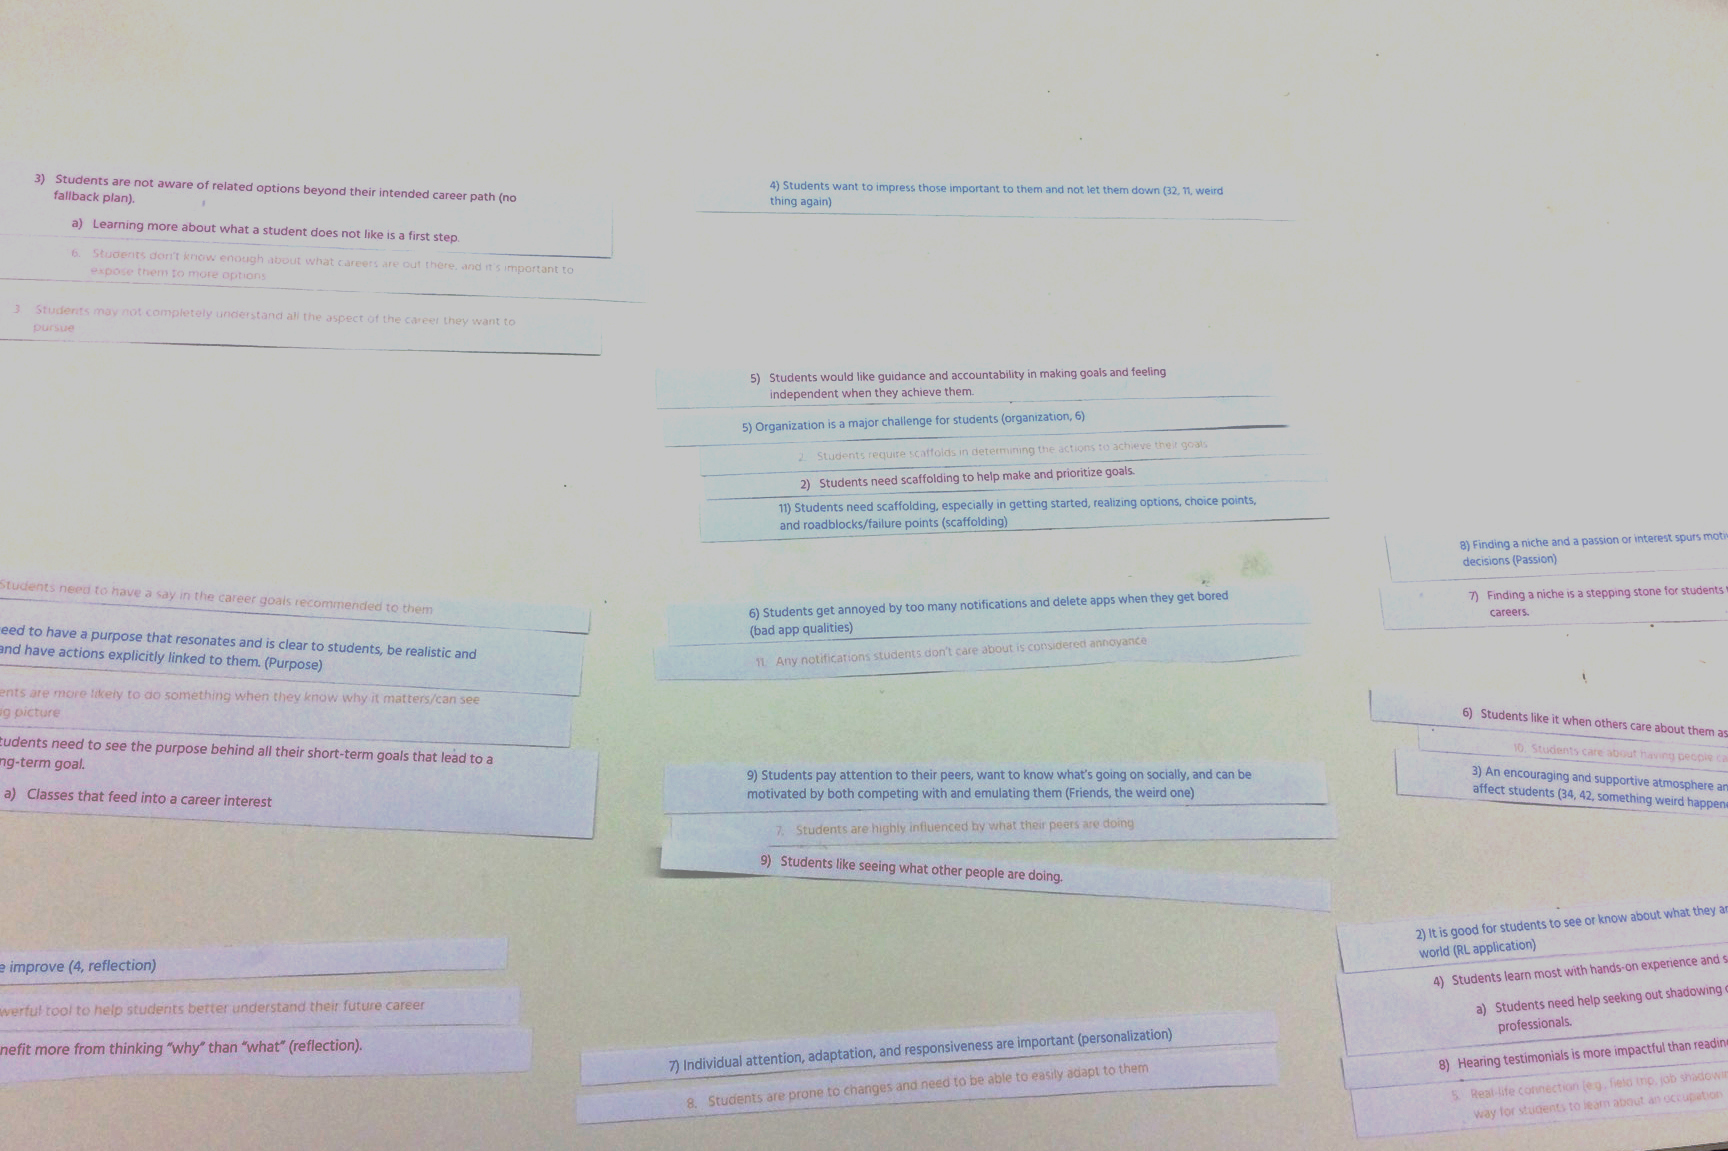
14 categories → 9 research findings | From these final 14 categories, we each proposed 10 research findings. Doing this work individually allowed us to leverage our different perspectives. Due to the systematic nature of our synthesis process to this point, there was extensive overlap in our results. We synthesized our individual findings into 9 research findings that are presented in the next section.
Our Findings
The Mountaineering Model
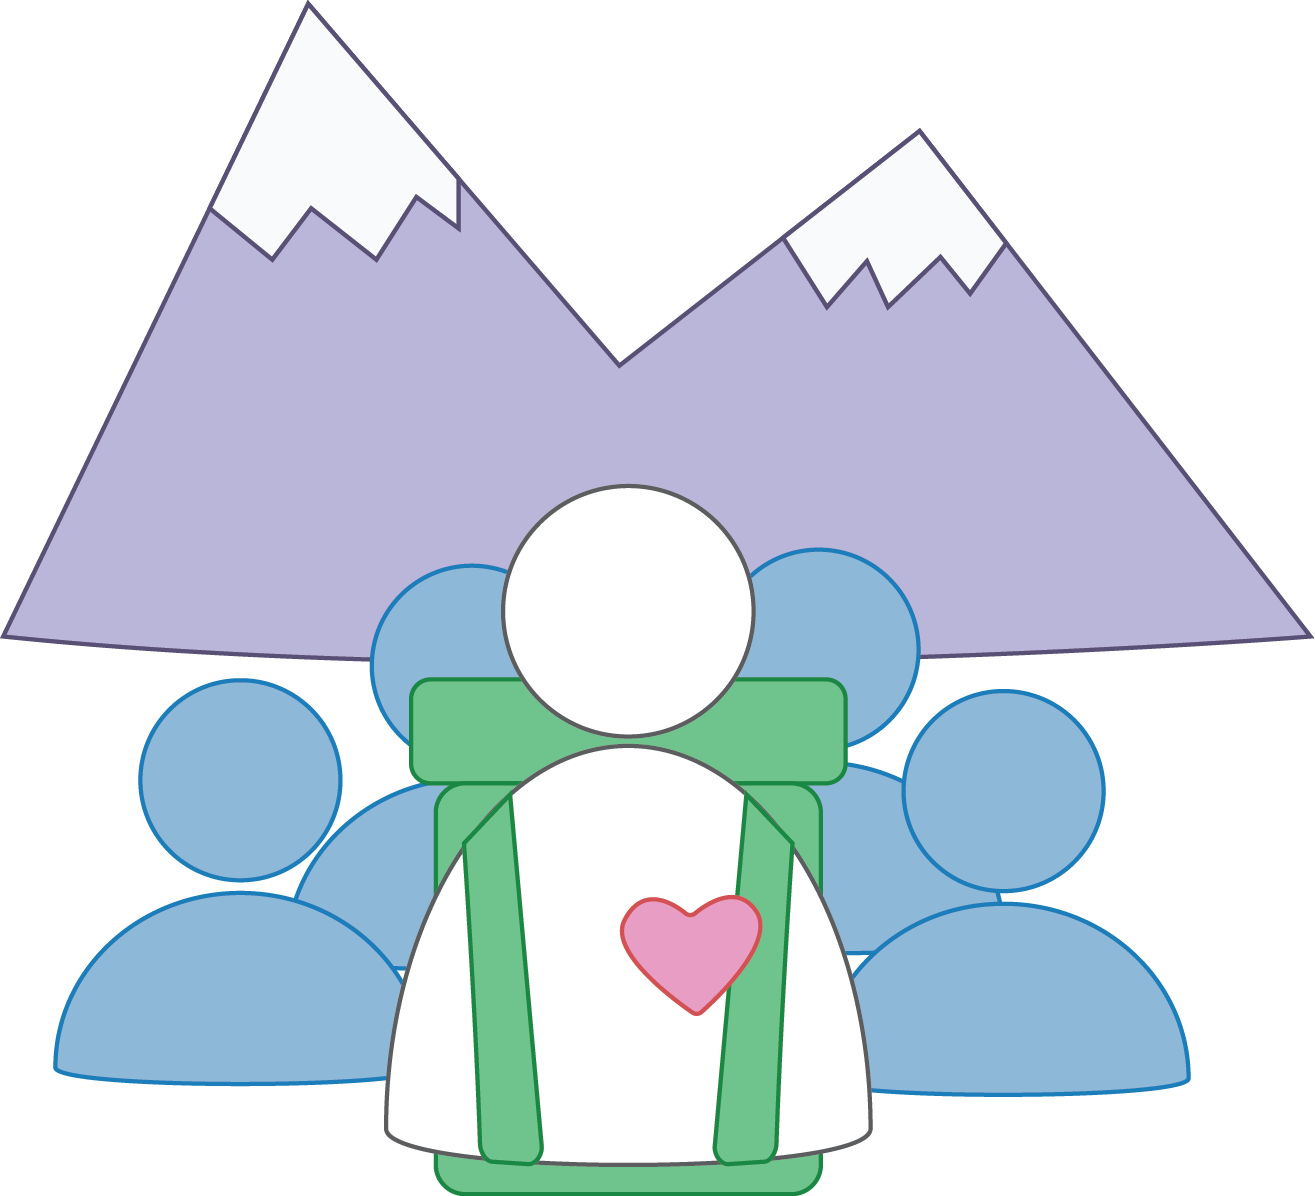
We found that the nine findings fell into three distinct themes, which are best illustrated with a mountaineering metaphor. Imagine a student at the bottom of a mountain with academic and career goals at the summit. MARi Mobile aims to provide guidance on the path up that mountain, and it can do so by influencing with three factors: grit, gear, and group.
Grit comes from within the student. Findings related to grit concern a student’s own mental state and perspective. Gear is the external tools that best equip a student for success. These findings relate to the support and scaffolding that a product should provide to the student. Finally, Group refers to the substantial impact of other people on the student. It matters who you’re with, both for motivation and support.
Grit
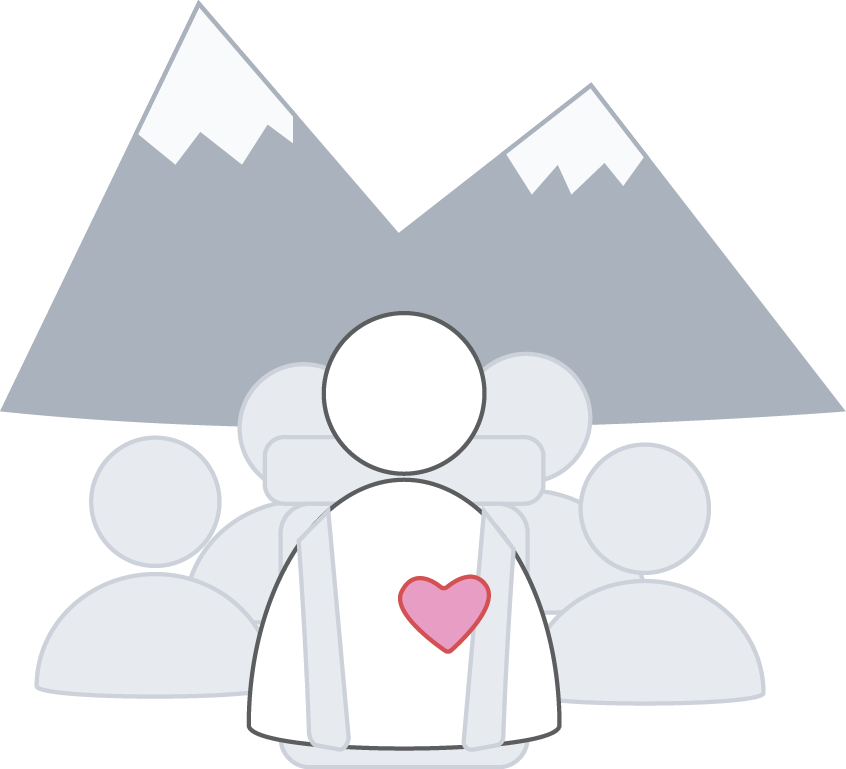
Grit comes from within the individual student and is essential to enduring for the long run. Students need to start with themselves and their interests as a basis to start career searching because it is important for them to reflect on and be realistic choosing a career that best fits their skills and personality. Our findings related to Grit are about Passion, Purpose, and Reflection.
- Passion | Finding a niche spurs intrinsic motivation and career decision-making
- Purpose | Students prefer when short-term goals are concretely linked to meaningful long-term outcomes
- Reflection | Students benefit from mindful reflection on both past actions and future goals
Gear
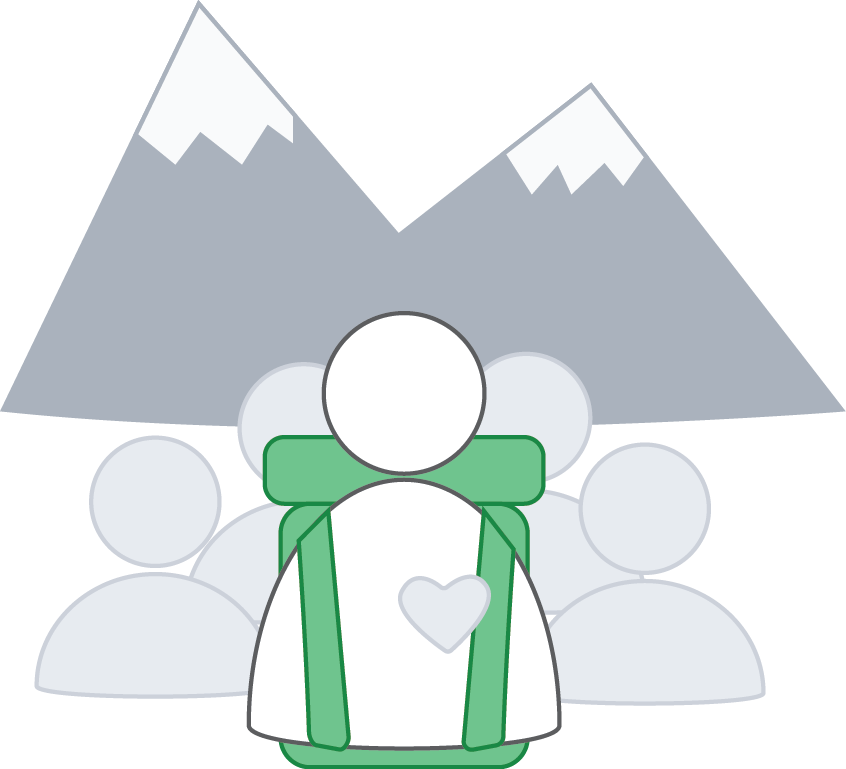
Gear is the equipment that prepares the student for her journey and supports her throughout it. For academic and career goals, gear includes personalized support and scaffolding through various tools and systems for students’ particular needs to reach their goals. Our findings related to Gear are about Scaffolding, Awareness, and Personalization.
- Scaffolding | Students benefit from scaffolding when initiating behavior and problem solving
- Awareness | Students lack both breadth and depth of information to make decisions about careers
- Personalization | Students expect tools to be adaptive and responsive to changing needs
Group
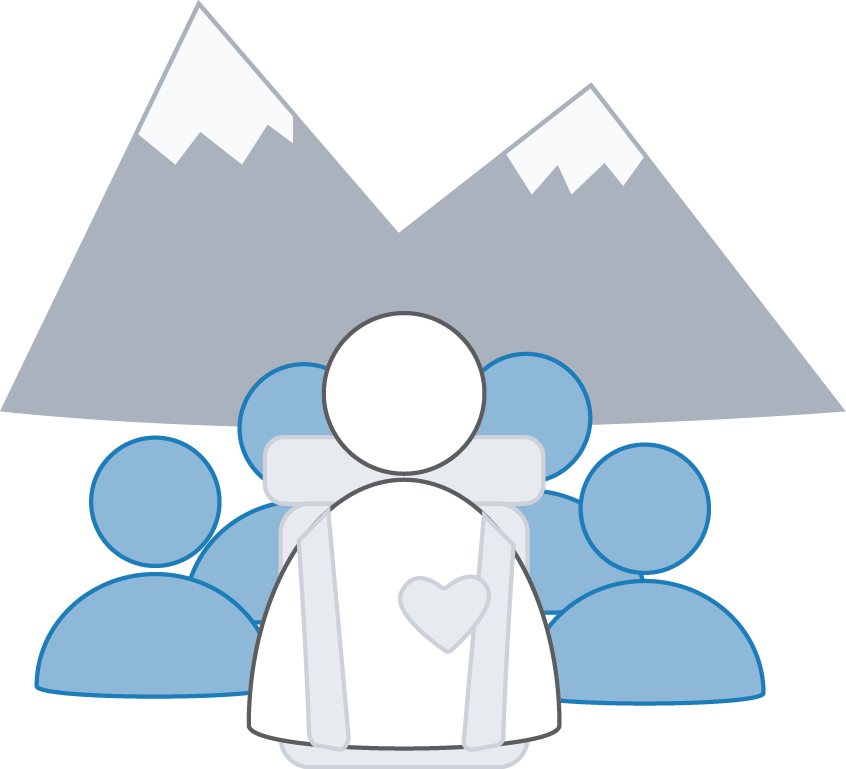
Group represents the human connections students need to feel challenged, cared for in a community, and to tie abstract descriptions to a real-world job. Just like a climber with a team of friends, students feel more comfortable exploring careers knowing others are on the same journey or looking out for them. Our findings related to Group are about Peers, Care, and the Real World.
- Peers | Students like to see what their peers are doing and are influenced by them
- Care | Students thrive in an atmosphere of focused care
- Real World | Students learn best through real-life connections and experiences